
On Wednesday morning, the markets wavered, with cautious trading across the board, except for the Dow, which outpaced the S&P 500 and Nasdaq. Looking for stocks showing strength amid the uncertainty, I turned to the Market Movers tool on my Dashboard. What I found caught my attention.
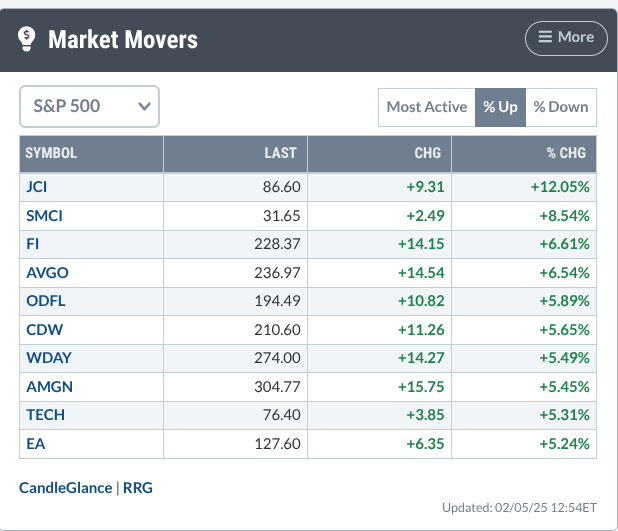
FIGURE 1. MARKET MOVERS TOOL. AMGN, third from bottom, caught my attention, as the sector has been showing up on quite a few bullish StockCharts scans.Image source: StockCharts.com. For educational purposes.
The Health Care sector has been showing up on various scans over the past week, and Amgen, Inc. (AMGN) has been on my radar for quite some time due to several developments that I’ve been following.
To begin, I needed to get a wider perspective, so I switched to MarketCarpets and zoomed-in on the one-day performance of the Health Care sector.
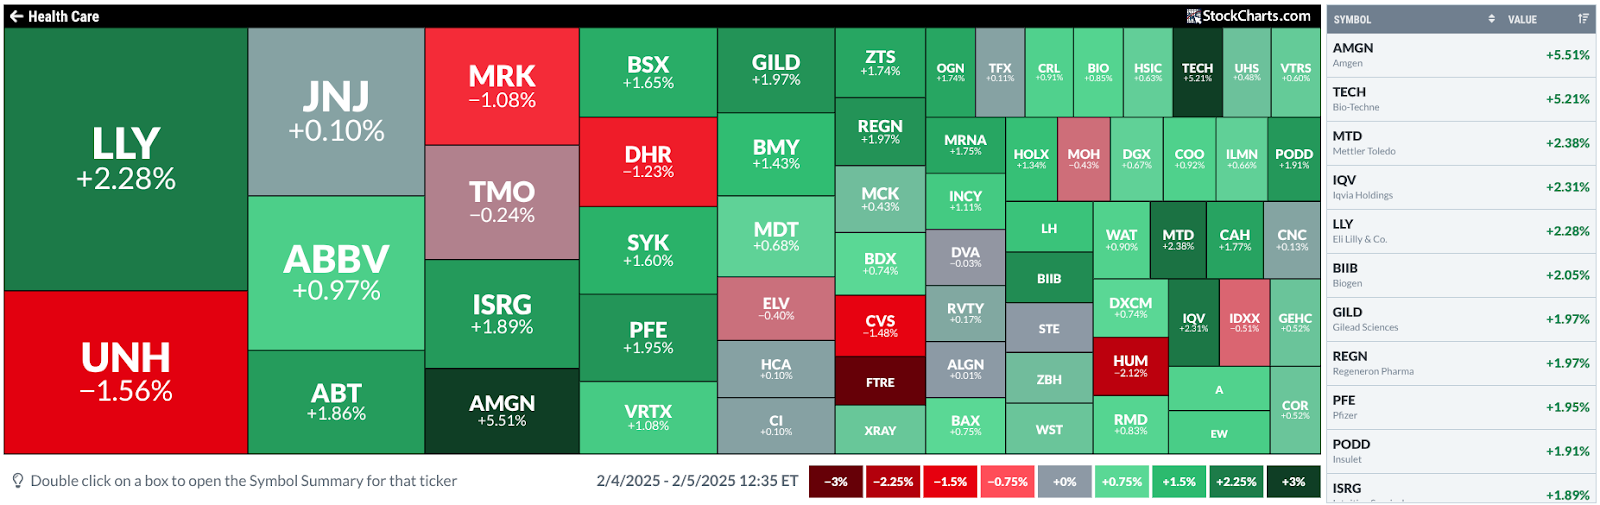
FIGURE 2. MARKETCARPETS FOR THE HEALTHCARE SECTOR. Notice AMGN at the top of the list on the table to the right.Image source: StockCharts.com. For educational purposes.
Amgen’s stock surged over 5% (top of the table on the right) despite an FDA hold on its obesity drug trial, as strong Q4 earnings beat Wall Street’s expectations. On top of this, its sales for Repatha soared 45%, and its promising weight-loss drug MariTide is set for late-stage trials in mid-2025.
At this point, I wanted a clearer picture of how AMGN stacked up against its peers. I compared its performance to the biotech industry ($DJUSBT), the pharmaceutical sector ($DJUSPR), and the broader healthcare market (XLV) using PerfCharts. Here’s what I got:
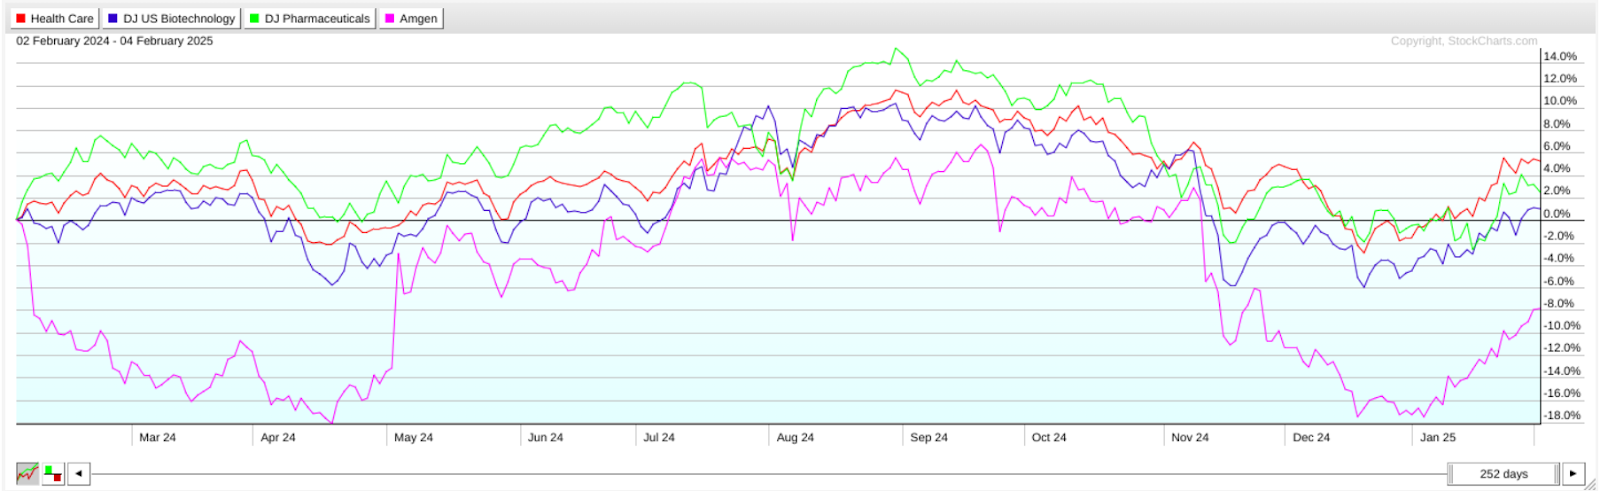
FIGURE 3,. PERFCHARTS COMPARING THE HEALTH CARE SECTOR WITH BIOTECH AND PHARMA INDUSTRIES AND AMGEN. The one-year comparative lookback shows AMGN dragging significantly.Chart source: StockCharts.com. For educational purposes.
Over the past year, AMGN significantly underperformed both industries and the broader sector. So, does Wednesday’s rally indicate strong optimism on weak prospects, or does it present an undervalued opportunity with plenty of room to run?
Let’s take a longer-term view of AMGN’s price action and analyze its weekly chart.
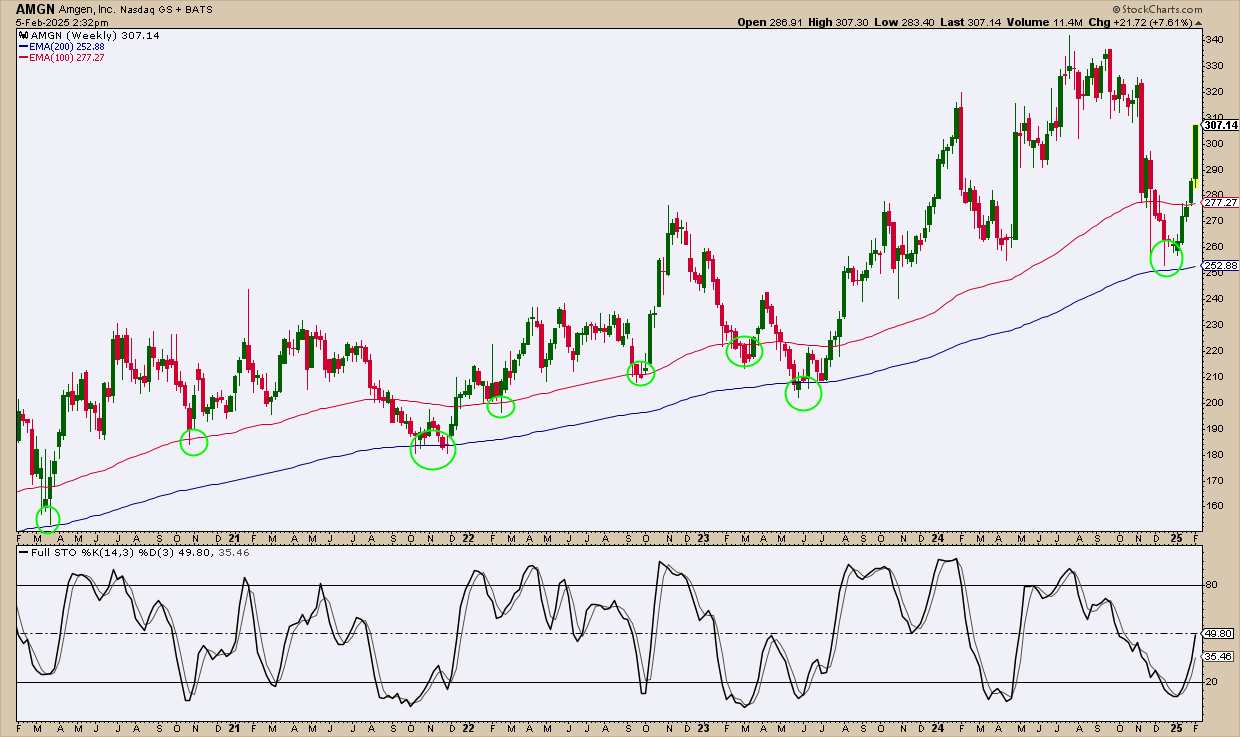
FIGURE 4. WEEKLY CHART OF AMGN. Note how price respected the 100- and 200-period EMAs.Chart source: StockCharts.com. For educational purposes.
AMGN’s fluctuations over the last five years may have been volatile, but the underlying trend has been relatively steady and bullish. Notice how AMGN’s price respected the 100-period and 200-period exponential moving averages (EMAs). Also notice how this dynamic is captured by the Stochastic Oscillator, which reflects the upward bounces in its oversold range below the 20 level signaling renewed buying pressure. Based on the current reading, the indicator is barely reaching the 50-line, suggesting that if AMGN maintains its bullish momentum, it has plenty of room to run before it’s in overbought territory.
But things may look different on a daily scale, so let’s shift over to a daily chart.
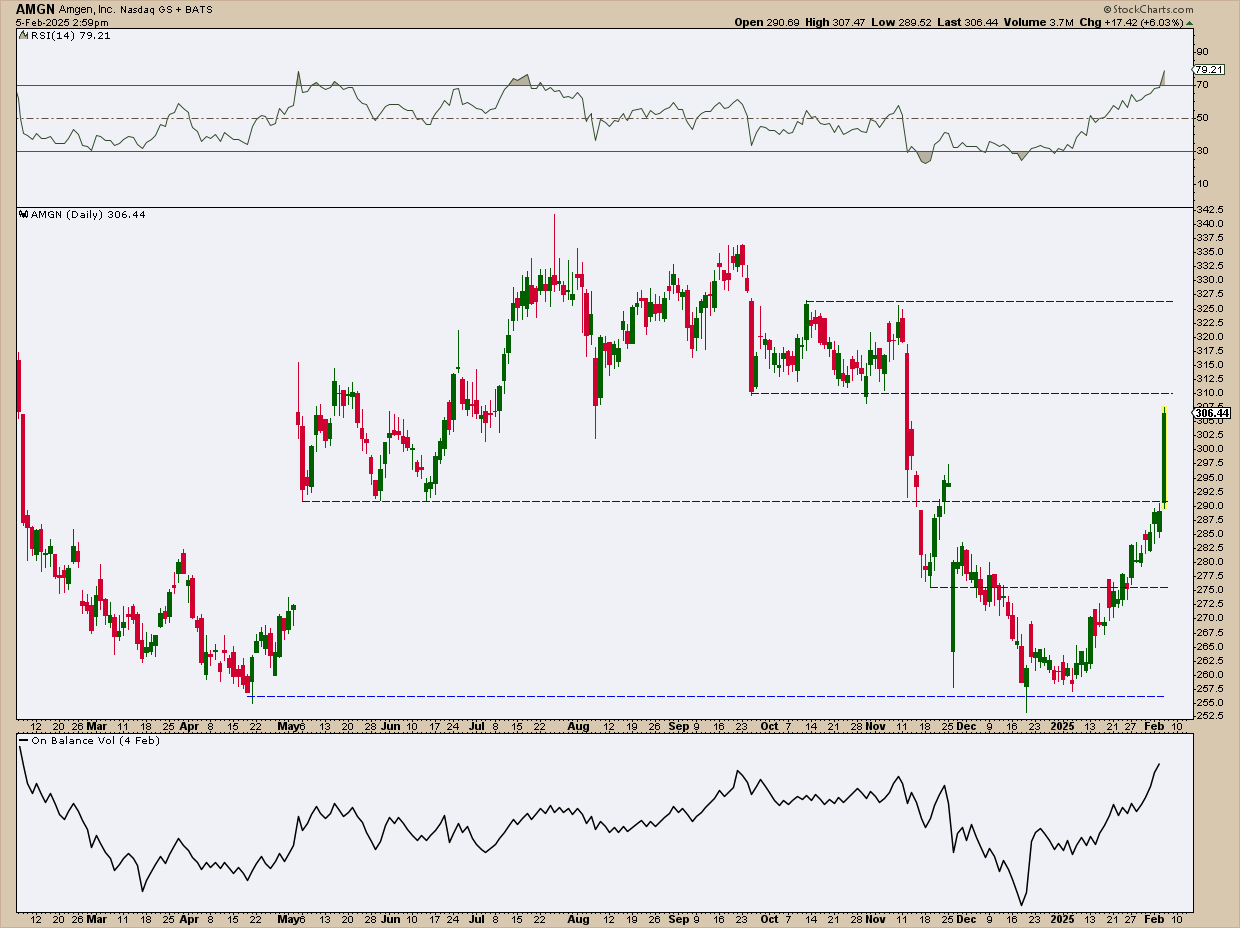
FIGURE 5. DAILY CHART OF AMGN. Watch the support and resistance levels for entry and exit points.Chart source: StockCharts.com. For educational purposes.
Following a steep descent last November, AMGN found support the next month near $257.50, coinciding with its April 2024 low. That level was retested twice before the sharp rally that culminated in Wednesday’s price spike.
While the On Balance Volume (OBV) shows strong buying pressure fueling the surge, the Relative Strength Index (RSI) suggests the current swing is overbought. Considering the parabolic trajectory of the move, it’s likely that momentum will stall and price will eventually pull back in the next few sessions.
Key levels to watch:
Upside Resistance:
- AMGN faces resistance at $310 and $327.50, which mark the lower and upper boundaries of its most recent consolidation range.
Downside Support:
- If AMGN pulls back before breaking these resistance levels, the first key support to watch is $291, a level that held multiple times during May–June 2024, signaling strong buying interest.
- The second level of support would be at $275, the November swing low.
If price falls below $275, the likelihood of a bullish reversal becomes uncertain, as this breakdown could signal weakening technical (and also fundamental) momentum.
At the Close
AMGN is another relatively expensive stock. If this is the case, then you might want to take a look at the OptionsPlay Strategy Center to find alternative strategies that better align with your capital resources and risk tolerance. AMGN’s recent rally, while impressive, raises important questions about its sustainability. You can use the tools mentioned above to find similar stocks if AMGN doesn’t interest you. If it does, however, the key levels discussed above should help guide you in your analysis.

Disclaimer: This blog is for educational purposes only and should not be construed as financial advice. The ideas and strategies should never be used without first assessing your own personal and financial situation, or without consulting a financial professional.